


Top Line
Recent data point to a labor market that is cooler than a year ago, inflation that has moderated on a 12-month basis, and consumer credit performance that is stabilizing in bank-reported metrics. Revolving credit outstanding remains high in level terms but is declining on a year-ago basis. Housing activity is still constrained by affordability, though resale inventory has improved versus last year and prices remain slightly higher year over year.
Labor Market
The unemployment rate rose to 4.6% in Nov 2025, up from 4.2% in Nov 2024, indicating a softer labor market versus a year ago. Labor force participation and the employment-population ratio were 62.5% and 59.6% in Nov 2025, respectively; both series show a missing Oct 2025 observation in the latest vintage.
Weekly initial jobless claims remain consistent with a still-functioning labor market: 214k for the week ending Dec 20, 2025, down from 237k two weeks prior. Labor demand indicators are mixed but generally cooler versus peak conditions: job openings were 7.67 million (Oct 2025), with hires at 5.15 million and the quits rate at 1.8% (Oct 2025). The quits rate has moved down from recent months, consistent with reduced job-switching. Average weekly hours for total private workers held around the mid-34 hour range (34.3 hours in Nov 2025), broadly stable.
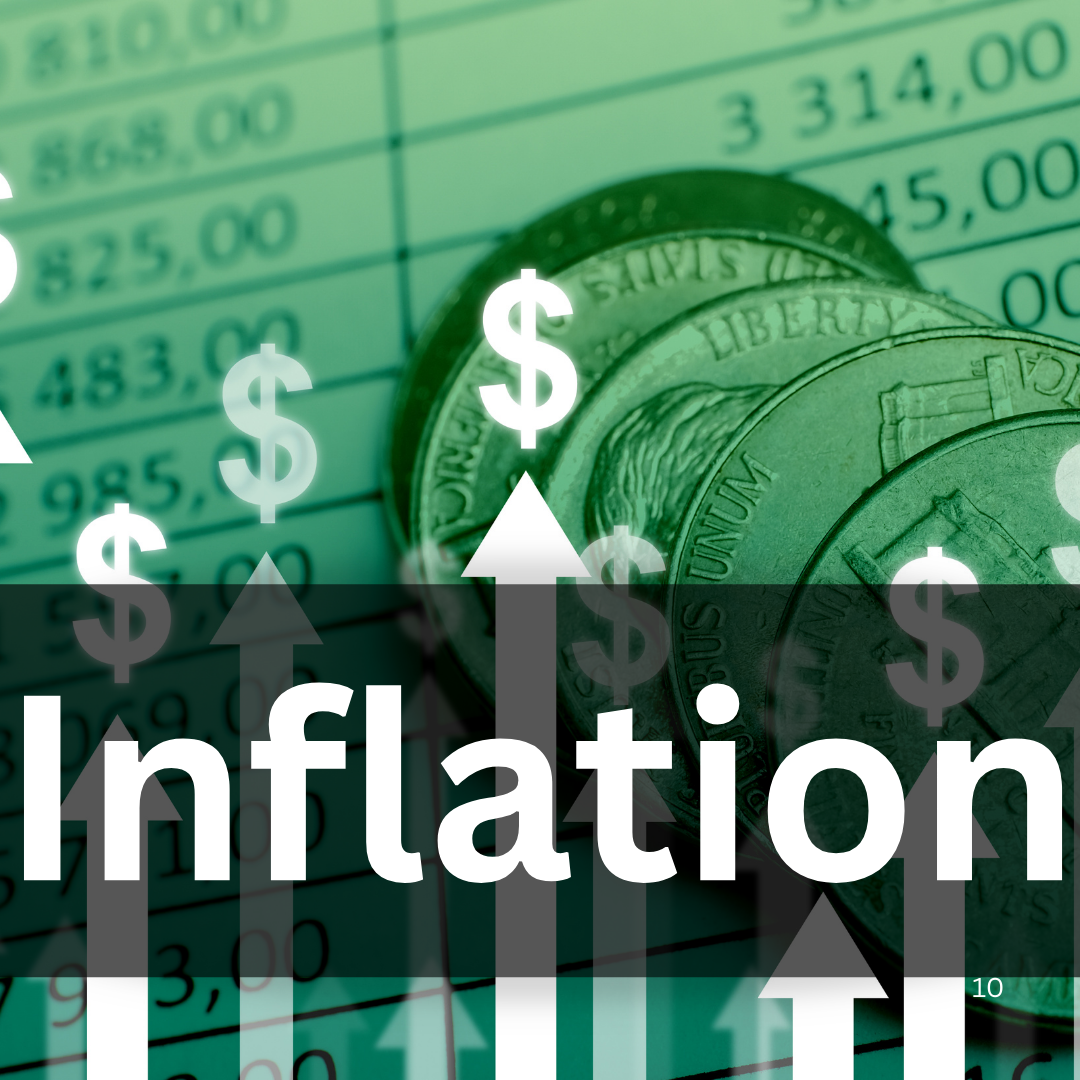
Inflation
The Nov 2025 CPI report showed headline CPI up 2.7% YoY and core CPI up 2.6% YoY. Within the core basket, shelter inflation was 3.0% YoY, remaining a key driver of services inflation. Food inflation was 2.6% YoY, while energy inflation was higher at 4.2% YoY.
Transportation-related CPI components in the dashboard were mixed. New vehicle prices were roughly flat on a sequential basis in recent months (Nov 2025 level close to Oct 2025), while used vehicle prices were reported higher on a 12-month basis in the CPI release narrative. Motor-vehicle parts/equipment and maintenance/repair remain elevated versus pre-pandemic baselines, consistent with ongoing pressure in non-discretionary goods and services tied to vehicle ownership. Note: the CPI release also reflected disruption from the federal government shutdown, including a missing Oct 2025 CPI month in the published CPI time series.
Credit Card Market
Revolving consumer credit outstanding (owned and securitized) was $1.317T (Oct 2025, SA) and is down 2.5% YoY on the series’ percent-change-from-year-ago view, implying slower revolving balance growth than in prior years. In bank performance data, credit card credit quality improved on a year-over-year basis: the delinquency rate on credit card loans at all commercial banks was 2.98% (Q3 2025) versus 3.19% (Q3 2024), and the charge-off rate was 4.17% (Q3 2025)versus 4.68% (Q3 2024).
Senior Loan Officer Opinion Survey (SLOOS) diffusion indexes suggest standards are still net-tightening but far less restrictive than last year. Net percent tightening standards for credit card loans was 4.2 (Q4 2025) versus 18.4 (Q4 2024). Demand turned modestly positive: net percent reporting stronger demand for credit card loans was 4.3 (Q4 2025) after negative readings earlier in 2025.
Auto Market
Light vehicle sales were 15.9 million SAAR (Nov 2025) versus 15.6 million (Nov 2024), indicating a modest year-over-year increase in unit volumes. In consumer credit aggregates, motor vehicle loans owned and securitized were reported at $1.565T (Sep 2025, NSA), with the most recent observations showing incremental growth versus mid-2025 levels.
On underwriting conditions, SLOOS indicates easing on net: the net percent of domestic banks tightening standards for auto loans was -5.8 (Q4 2025), an easing signal versus Q4 2024 (4.1). By contrast, demand for auto loans remained negative on net (DEMAUTO Q4 2025), consistent with rate-sensitive affordability constraints. Auto financing rate data in the dashboard are not current: the commercial bank 48-month new auto loan rate last posted at 7.51% (Aug 2025).
Student Loans
Student loans owned and securitized were $1.841T (Sep 2025, NSA), up versus mid-2025 (e.g., Jun 2025). The latest observations indicate continued growth in outstanding balances, with the series not yet updated beyond September in the current dashboard pull.
Mortgage and Housing Finance
Existing home sales were 4.13 million SAAR (Nov 2025), slightly below 4.17 million (Nov 2024), indicating continued subdued resale turnover. Inventory conditions improved relative to last year: months’ supply was 4.2 (Nov 2025) versus 3.8 (Nov 2024), though still not high by pre-2020 norms. Prices remain higher year over year: the median existing home sales price was $409,200 (Nov 2025) versus $404,400 (Nov 2024).
Affordability improved modestly from a year ago: the fixed-rate housing affordability index was 106.2 (Oct 2025) versus 102.5 (Oct 2024), though the absolute level still implies constrained affordability versus pre-tightening years. Broad house price appreciation remains positive: FHFA purchase-only HPI was 435.56 (Aug 2025) versus 425.16 (Aug 2024)(~+2.4% YoY). Mortgage debt service edged higher in the latest available quarter (MDSP 5.89% in Q2 2025 vs 5.77% in Q2 2024), consistent with elevated mortgage rates and high prices. On the credit channel, SLOOS showed stronger net reported demand for GSE-eligible mortgage loans (12.1 in Q4 2025) versus 3.6 in Q4 2024, aligning with a modest demand pickup off low activity levels.